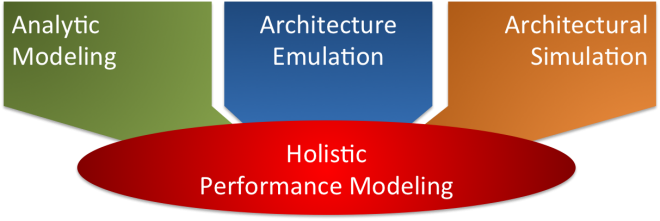
Performance modeling and evaluation is critical for almost any aspect of the exascale co-design process. It allows us to both understand and anticipate computation and communication needs in applications, it identifies current and future performance bottlenecks, it helps drive the architectural design process and provides mechanisms to evaluate new features, and it aids in the optimization and the evaluation of transformations of applications.
The two most common approaches are analytical models, sometimes referred to as spread-sheet models, which capture high-level characteristics of codes and provide stable extrapolations; and architectural simulators, which can capture low-level performance details at varying granularity. Both techniques have proven to be essential elements in the modeling process, but also have their shortcomings. Analytical models typically require a lot of manual effort to construct and (on purpose) omit many low-level details, while architectural simulators are often complex, limited to modest sized kernels, and costly in their execution.
To overcome these shortcomings, we are developing techniques that complement analytic models and architectural simulation by emulating the behavior of anticipated future architectures on current machines. In particular, we are focusing on the impact of resource limitations by artificially restricting them, as well as noise and faults by using injection techniques, since these issues are generally expected to be the dominating challenges in future machine generations. This enables us to capture low-level execution details not covered by any other approach at scale and in real time and gives us the ability to observe full application behavior under future machine conditions.
The GREMLIN Framework
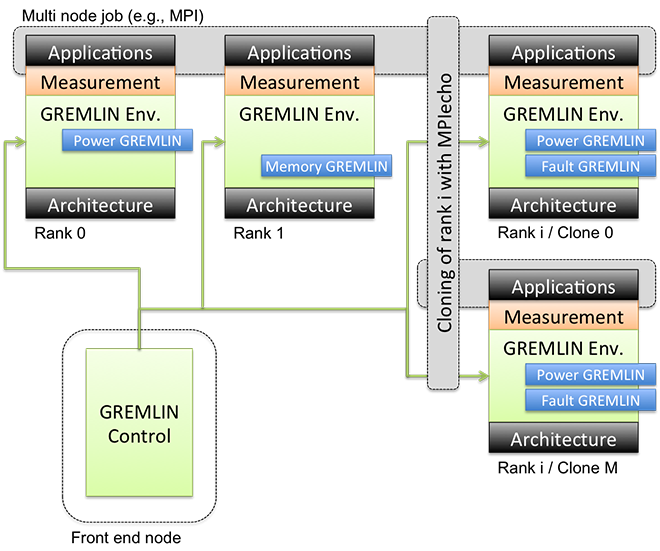
We are implementing our emulation approaches in what we call the GREMLIN framework (Figure attached below). One or more modules, each referred to as a GREMLIN and responsible for emulating one particular aspect, are loaded into the execution environment of the target application. Using the PnMPI infrastructure, we accomplish this transparently to the application and for an arbitrary combination of GREMLINS, providing the illusion of a system that is modified in one ore more different aspects.
For example, this allows us to emulate a combined effect of power limitations and reduced memory bandwidth. We then measure the impact of the GREMLIN modifications by either utilizing application-inherent performance metrics (e.g., iteration timings) or by adding performance monitoring tools within the PnMPI tool stack.
The GREMLINS
Within the GREMLIN framework we are currently experimenting with several different classes of GREMLINS: power GREMLINS artificially reduce the operating power using DVFS or cap power on a per node basis; thermal GREMLINS enable thermal throttling; resilience GREMLINS inject faults into target applications and enable us to study the efficiency and correctness of recovery techniques; bandwidth and memory GREMLINS limit resources in the memory hierarchy such as cache size or memory bandwidth by running interference threads; latency GREMLINS degrade memory latency; and noise GREMLINS inject periodic or random noise events to emulate system and OS interference.


